What Is Turnover Costing Your Restaurant?

What Is Turnover Costing Your Restaurant?

Free Turnover Cost and Retention Calculator for Restaurant Operators

Employee Turnover Cost Calculator

Replacing one hourly employee costs about 16% of a year's pay for jobs paying under $30,000, according to research from the Center for American Progress. For a part-time employee earning $15.25 an hour, that's about $3,200. Private employers lose about 43% of their workforce each year, and hourly frontline roles usually run higher, so turnover quietly costs most employers tens of thousands of dollars a year. This calculator shows what turnover costs you. It also shows how many employees you would need to keep to cover the cost of stronger supervision and recognition, and how much you could save by improving retention.


Two ways to improve employee retention

Much of what makes an hourly employee stay or leave happens during an ordinary shift: how the work is run, how a new hire is treated in the first few weeks, and whether good work gets noticed. That holds true on a plant floor, in a nursing home, at a store, or in a kitchen. Two things shape it more than anything else.

Step 1 in the calculator

Stronger daily supervision

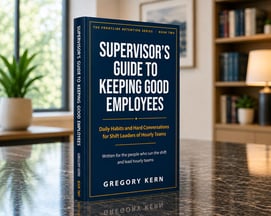
Supervisor's Guide to Keeping Good Employees book on a table

Your supervisors shape every workday. Supervisor's Guide to Keeping Good Employees gives them practical daily habits and a way through hard conversations, written for leaders of hourly teams. $14.99, with free companion Practice Cards.

See the book
Step 2 in the calculator

Add recognition

Shining star award graphic with a glowing star and blue background.

Spot Award Cards let supervisors thank people the moment good work happens.

Employee receiving an appreciation awardAward Packets mark early milestones when turnover runs highest. Each is redeemable for a gift of choice the employee picks.

See recognition options

This calculator puts a dollar figure on both stronger supervision and recognition. It shows how many employees each would need to keep to cover its cost, and you decide whether that's realistic for your team.


How it works

  1. Enter your locations, employees, and departures to see what turnover costs you.
  2. See how many employees stronger daily supervision would need to keep to cover its cost.
  3. Add the Retention and Recognition Program to the book's guidance and see what the two could save together.

About the starting numbers: the calculator opens with an example based on restaurant industry data, where turnover runs highest. Replace them with your own headcount, pay rate, hours, and departures. If you don't track turnover, use the typical rate for your industry below.

Typical annual turnover by industry, 2025
Industry Turnover
Restaurants and hotels 66%
Transportation and warehousing 48%
Construction 48%
Retail 46%
All private employers 43%
Health care and social assistance 35%
Manufacturing 29%
Government 18%

Source: Bureau of Labor Statistics, Job Openings and Labor Turnover Survey, 2025. Figures include all employees in each industry; hourly frontline roles usually run higher.

It takes about two minutes. Nothing you enter is saved unless you ask us to email your results.

Your team
Your annual turnover rate
Estimated cost of each departure
Estimated annual cost of turnover

Restaurants and hotels nationally: about 66% a year, and about 51% counting only employees who quit (U.S. Bureau of Labor Statistics, 2025).

Refine with your own pay and costs

How to estimate the cost of each departure

See how each departure's cost adds up
Total per departure
Step 1: Stronger daily supervision

Supervisor's Guide to Keeping Good Employees teaches shift leaders the daily habits and hard conversations that shape how an hourly workday goes. The book is $14.99 a copy. The larger investment is your supervisors' time.

Step 2: Add recognition to the book's guidance

Retention and Recognition Program

A Simple Recognition Plan to Help Frontline Employees Feel Valued - and Stay

Supervisors put the Supervisor's Guide into practice, and recognition backs it up with two simple tools:

Select-Your-Gift Spot Award Card presented to an employee

Spot Award Cards that supervisors hand out the moment good work happens, each redeemable for a $30 gift of choice.

Select-Your-Gift milestone award packet with certificate and gift of choice

Milestone award packets at 90 days ($40), 6 months ($60), and 1 year ($80), the early months when turnover runs highest.

Adjust your program

Employees reaching each milestone per location each year. We estimate these from your turnover, after the people your estimates say you would keep. Leave a box blank to use our estimate, or enter your own number.

See what the program costs
Total per year

How these numbers are calculated

Turnover rate is employees who left in the last 12 months divided by your average number of employees. If you manage more than one location, enter per-location averages; totals for all your locations are those figures multiplied by the number of locations. The national figure comes from the Bureau of Labor Statistics Job Openings and Labor Turnover Survey for accommodation and food services in 2025: an average monthly separation rate of 5.5%, or about 66% over a year. It is updated each March.

Default pay rates are May 2025 national medians from the Bureau of Labor Statistics for food and beverage serving workers and for supervisors of food preparation and serving workers. Replace them with your own. The 11% payroll default reflects legally required employer costs (Social Security, Medicare, unemployment insurance, and workers' compensation) for service workers in the Bureau of Labor Statistics Employer Costs for Employee Compensation survey, June 2026. Including all benefits, the figure is about 30%.

By default, the cost of each departure uses research from the Center for American Progress, which reviewed 30 case studies and found that replacing an employee in a job paying less than $30,000 a year costs about 16% of that employee's annual pay. The calculator applies that figure to your pay rate and weekly hours. For a more detailed estimate, choose the itemized method under "Refine with your own pay and costs." Its defaults are deliberately conservative: they count the pay and supervisor time spent separating, hiring, and training, the overtime premium for covering open shifts, and a new hire's learning curve valued at their pay, and leave out lost sales, service mistakes, and the strain on the rest of the crew.

The starting estimates assume stronger supervision keeps 10% of the people you would otherwise lose, and recognition another 10%, for 20% together. They are based on research. A study of a large company published in the Journal of Political Economy (Hoffman and Tadelis, 2021) found that employees moved from the managers with the weakest people skills to those with the strongest were about 60% less likely to leave. Gallup and Workhuman (2024) found that employees who received high-quality recognition were 45% less likely to have left after two years. Gallup also found that, in high-turnover organizations, the most engaged teams have about 21% less turnover than the least engaged. Because these studies compare the best with the worst, the calculator assumes a restaurant that commits to both closes most, but not all, of that gap, and keeps the total within Gallup's 21%. No one can promise a specific result for your restaurant, so replace the estimates with your own.

Milestone counts assume your headcount stays about the same, so you hire about as many people as leave. They use your turnover after the people your estimates say you would keep. Keeping more people means fewer new hires, so early milestone awards change only slightly.

Gift-of-choice prices include shipping of the gift the employee selects. Each Gift of choice Award packet includes a certificate that can be customized with your company name and logo, the milestone, and employee name for a small additional charge. Shipping of spot cards and award packets to your locations is billed separately.


What to do next

Talk it through

Walk through your numbers with us and get recognition options sized to your locations. Call 630-954-1287 or email gkern@select-your-gift.com, Monday through Friday, 8:30 to 5 Central.

Start with your supervisors

Supervisor's Guide to Keeping Good Employees gives supervisors the daily habits and hard conversations that shape whether good people stay. Bulk copies are available for multiple locations. See the book

Explore recognition

See how spot award cards and milestone award packets work, and how gift of choice lets each employee pick a reward that means something to them. See recognition options


Frequently asked questions

These are estimates to help you plan, not financial advice.

How much does it cost to replace an hourly employee?

Research from the Center for American Progress puts the cost at about 16% of a year's pay for jobs paying under $30,000. For a part-time employee earning $15.25 an hour, that's about $3,200. The calculator applies this to your own pay rate and hours, or lets you build the cost item by item.

What is a normal employee turnover rate?

It depends on the industry. Bureau of Labor Statistics data for 2025 shows private employers overall lost about 43% of their workforce. Restaurants and hotels lost about 66%, transportation and warehousing about 48%, construction about 48%, retail about 46%, health care and social assistance about 35%, manufacturing about 29%, and government about 18%. These figures include all employees, so turnover among hourly frontline roles usually runs higher.

How do I calculate my turnover rate?

Divide the number of employees who left in the last 12 months by your average number of employees. A location averaging 40 employees that lost 30 people has a 75% turnover rate.

What's the difference between turnover and retention?

Turnover counts the people who leave. Retention measures the people who stay. They aren't simply opposites: a location with 75% turnover hasn't necessarily lost three-quarters of its original team, because some positions turn over several times in a year while a steady core stays. Improving retention means keeping more of the people you hire, especially in their first months.

Where do the calculator's starting numbers come from?

The starting numbers are an example based on restaurant industry data, where turnover runs highest. Replace them with your own headcount, pay rate, hours, and departures. If you don't track turnover, use the typical rate for your industry from the table above.

Why is this cost lower than some figures I've seen?

Some widely quoted figures come from older studies, focus on a single industry, or are based on salaried roles. This calculator uses research on lower-wage jobs and counts only costs you can measure: hiring, training, overtime, and a new hire's learning curve. It leaves out lost sales, missed production, and strain on the team, so your true cost is likely higher.

How can employers improve retention of hourly employees?

Most of the opportunity lies in the first weeks and months, when new hires are most likely to leave. Two practical steps make the biggest difference: supervisors who run the workday well and handle problems early, and recognition that notices good work when it happens and marks early milestones. This calculator shows what each would need to accomplish to pay for itself.

Does recognition actually reduce turnover?

Research consistently links recognition to lower turnover. Gallup and Workhuman tracked nearly 3,500 employees and found that those who received high-quality recognition were 45% less likely to have left their jobs after two years. No one can promise a specific result for your organization, so the calculator starts with a conservative estimate and lets you change it.

How are the starting estimates calculated?

The calculator starts by assuming stronger supervision keeps 10% of the people you would otherwise lose, and recognition another 10%. Research comparing the best and worst managers, and well-recognized and poorly recognized employees, finds much larger differences for each one alone. Together, the two estimates stay within Gallup's finding that the most engaged teams have about 21% less turnover than the least engaged. You can replace them with your own numbers.

Why start with supervisors?

Supervisors shape how an hourly employee's workday goes more than anyone else. Stronger daily habits cost little: at the starting numbers, books and training time come to about $764 per location, which pays for itself if it helps keep one person a year.

What does the Retention and Recognition Program include?

The program pairs Spot Award Cards, which supervisors hand out the moment good work happens, with award packets at three early milestones: 90 days, 6 months, and 1 year. Each card and packet is redeemable for a gift of choice: $30 for each card, and $40, $60, and $80 for the milestone packets. The calculator starts with one card a month for every five employees, which you can change. Certificates can be customized with your company name and logo, the milestone, and the employee's name for a small additional charge.

Can I use this for more than one location?

Yes. Enter your per-location averages and the number of locations, plants, stores, or sites. Results show per location and for all your locations together.

Is my information saved?

No. The calculator runs entirely in your browser. Nothing is saved unless you ask us to email your results.

Where do these numbers come from?

Turnover benchmarks come from the Bureau of Labor Statistics Job Openings and Labor Turnover Survey, wages from its Occupational Employment and Wage Statistics survey, and payroll costs from its Employer Costs for Employee Compensation survey. Replacement costs come from the Center for American Progress. We update the figures each year as new data is released.