What to do next
Talk it through
Walk through your numbers with us and get recognition options tailored to your needs and locations. Email jkern@select-your-gift.com
or Call 630-581-0096
Monday through Friday, 8:30 to 5 Central.
Start with your supervisors
Supervisor's Guide to Keeping Good Employees gives shift leaders the daily habits and hard conversations that shape whether good people stay. Bulk copies are available for multiple locations. See the book
Explore recognition
See how spot award cards and milestone award packets work, and how gift of choice lets each employee pick a reward that means something to them. See recognition options
Frequently asked questions
These are estimates to help you plan, not financial advice.
How much does it cost to replace a restaurant employee?
Research from the Center for American Progress puts the cost at about 16% of a year's pay for jobs paying under $30,000. For a part-time crew member earning $15.25 an hour, that's about $3,200. The calculator applies this to your own pay rate and hours or lets you build the cost item by item.
What is a normal turnover rate for restaurants?
Restaurants and hotels lost about 66% of their workforce in 2025, according to the Bureau of Labor Statistics, and about 51% counting only employees who quit. That's down from about 85% in 2021. BLS groups restaurants with hotels, and its figures include seasonal and short-term employees.
How do I calculate my turnover rate?
Divide the number of employees who left in the last 12 months by your average number of employees. A location averaging 40 employees that lost 30 people has a 75% turnover rate.
What's the difference between turnover and retention?
Turnover counts the people who leave. Retention measures the people who stay. They aren't simply opposites: a location with 75% turnover hasn't necessarily lost three-quarters of its original crew, because some positions turn over several times in a year while a steady core stays. Improving retention means keeping more of the people you hire, especially in their first months.
Why is this cost lower than some figures I've seen?
Some widely quoted figures come from older studies, focus on hotels, or are based on salaried roles. This calculator uses research on lower-wage jobs and counts only costs you can measure: hiring, training, overtime, and a new hire's learning curve. It leaves out lost sales and strain on the crew, so your true cost is likely higher.
How can restaurants improve employee retention?
Most of the opportunity lies in the first weeks and months, when new hires are most likely to leave. Two practical steps make the biggest difference: shift leaders who run the workday well and handle problems early, and recognition that notices good work when it happens and marks early milestones. This calculator shows what each would need to accomplish to pay for itself.
Does recognition actually reduce turnover?
Research consistently links engagement to lower turnover. Gallup found the most engaged teams in high-turnover organizations have about 21% less turnover than the least engaged, and recognition is one of the factors Gallup measures. No one can promise a specific result for your restaurant, so the calculator shows what recognition would need to accomplish to pay for itself and lets you judge whether that's realistic.
Why start with supervisors?
Shift leaders shape how an hourly employee's workday goes more than anyone else. Stronger daily habits cost little: at our defaults, books and training time come to about $764 per location, which pays for itself if it helps keep one person a year.
What do the recognition packages include?
Essentials includes "Thank You" spot cards and a 90-day award packet. Standard adds "Great Job" cards, cards for trainers whose new hires reach 90 days, and 6-month and 1-year award packets. Each card and packet is redeemable for a gift of choice. Certificates can be customized with your company name and logo, the milestone, and the employee's name for a small additional charge.
Can I use this for more than one location?
Yes. Enter your per-location averages and the number of locations. Results show per location and for all your locations together.
Is my information saved?
No. The calculator runs entirely in your browser, and nothing you enter is saved unless you ask us to email your results.
Where do these numbers come from?
Turnover benchmarks come from the Bureau of Labor Statistics Job Openings and Labor Turnover Survey, wages from its Occupational Employment and Wage Statistics survey, and payroll costs from its Employer Costs for Employee Compensation survey. Replacement costs come from the Center for American Progress. We update the figures each year as new data is released.


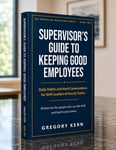 Your shift leaders shape every workday. Supervisor's Guide to Keeping Good Employees gives them practical daily habits and a way through hard conversations, written for leaders of hourly teams. $14.99, with free companion Practice Cards.